Survey analysis
In this article we'll focus on the analysis and interpretation of the data we got from the surveys we made and sent out in the last article.
We'll split this up in a few parts; Dutch responses, English responses and describing the similarities and differences between them.
To make it easier to refer to the surveys, we'll be noting down [EN] and [NL] next to data relating to the English and Dutch responses respectively.

At the time of writing this we got 48 responses in a 31.25 / 68.75% English to Dutch ratio. The image above was made on 31st of october, we have gathered more data since then.
Table of Contents
General observations #
Age #
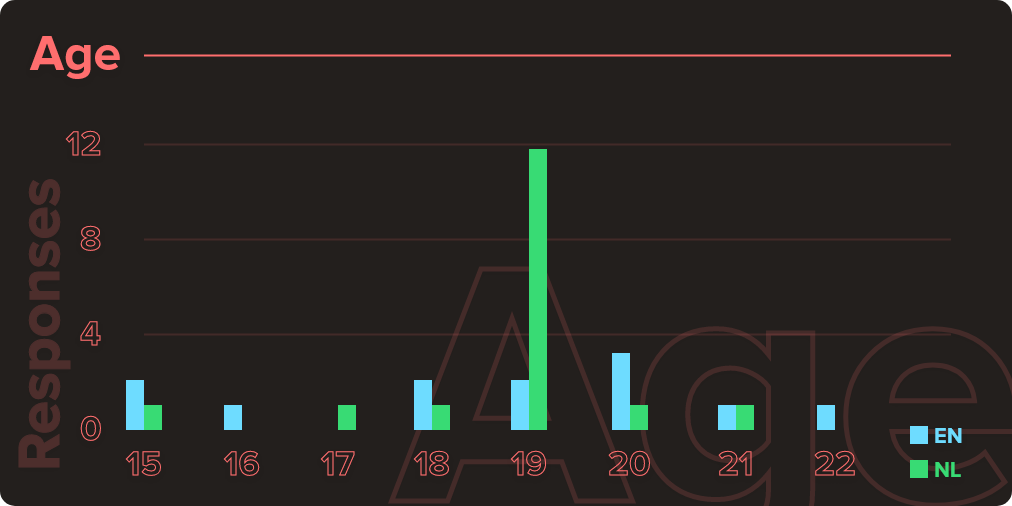
Taking a look at the data, there's a few things that drew our attention immediately.
The age range for both surveys is exactly the same, 15-22 [EN] and 15-22 [NL]. We think this is a good indicator of what audience we reached via these surveys.
The image above was made on 31st of october, we have gathered more data since then.
Gender #
In our results, we see that we have predominantly male respondents. It's not a perfect representation of our target audience but still valuable information. In the English responses, we have a 93.3% male and 6.7% female audience while the Dutch responses comprised of 72.7% male, 21.2% female and 6.1% non-binary. While not being evenly distributed, we still reached every gender-group of our target audience.

The image above was made on 31st of october, we have gathered more data since then.
Location #
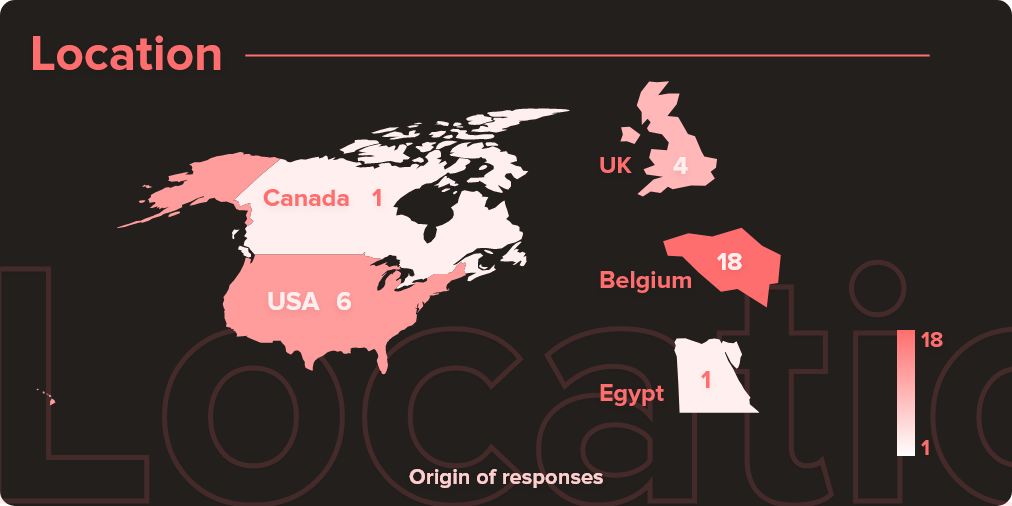
With the English form we tried to reach people from all over the world. This was to see if there are differences between news consumption through social media in Belgium from the rest of the world. We managed to get results from the United States of America, Canada, the UK but also had representation from the African continent, Egypt to be more specific. This data gave us some interesting insight in combination with the other questions.
The image above was made on 31st of october, we have gathered more data since then.
Screentime #
We asked people how much time they think they spend on social media and then we had them check how much time they really spend via the built in Screen Time app. The result was interesting. We thought most people were not going to be able to estimate their screen time accurately, but to our surprise most predicted their screen time accurately.
When we reviewed the answers, we noticed that screen time was relatively consistent across countries. We also noticed that approximately half the people who responded to the survey used social media for at least 2 hours a day.
After filling in the survey, multiple people reached out to tell us about how they never really thought about their time spent on social media. Some even considered removing social media apps from their devices. It's interesting to see that many people ignore how much screen time they use, or are not consciously aware of this. One respondent even mentioned that they use social media because it's addicting.
Because people mentioned that social media is addicting, this could be linked to the way they view certain platforms/services. There might be a bias towards a more negative general opinion of a platform from someone who's addicted. In this paper (§3.7) they talk about why social media is so addicting. Namely the infinite availability of news, and up to date information. It might be worth looking into the connection of these further to conclude how big the impact is.
Platform #
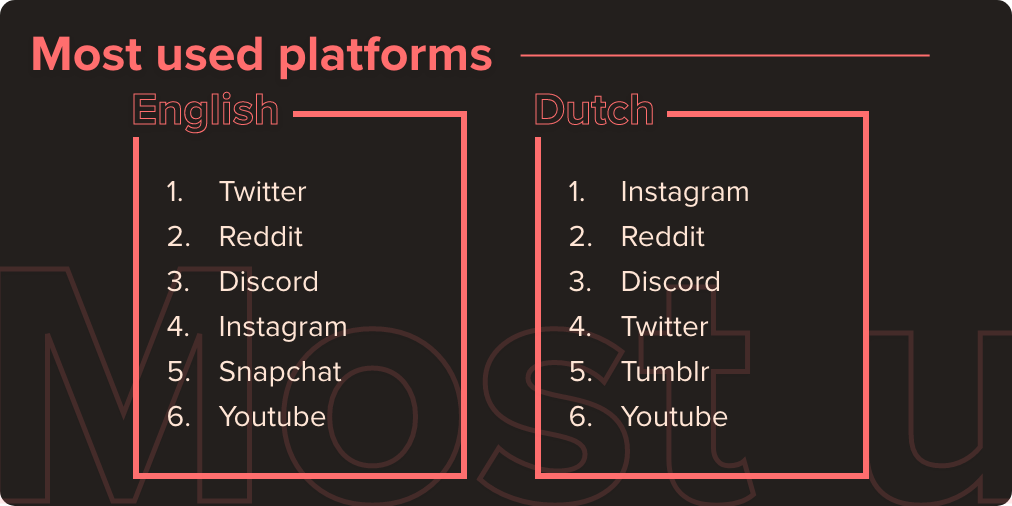
The platforms people use is an important variable in the equation since the news shown differs on each platform. We noticed a big difference between our Dutch survey and the English survey.
In the Dutch survey there was a big preference towards Instagram. With 45.5% of the total results this is clearly the most used social media platform among the Dutch community. Facebook and Reddit are also very popular with 12.1% each.
The image above was made on 31st of october, we have gathered more data since then.
When looking at the English results we see a bigger spread with Twitter and Reddit taking first place with 26.7% each. Instagram takes third place with 20%.
It's interesting that Instagram is very popular in Belgium with almost half of people choosing it as their most used social media platform, when we see it just takes third place in the English survey.
General Opinion #
For each platform they used, we also asked their general opinion about it.

The image above is outdated. It is still fairly accurate but isn't an exact representation of the date anymore.
From what we found, there is a correlation between the quality of news on a platform, and the general opinion. Snapchat for example has a pretty low general opinion (also due to a small sample size) but correlates to a negative view of the quality of the news on there.
Respondents also seem to be wary of the news they trust, and seek trustworthy and accurate sources. They seem to be aware of personal biases and take most unheard of sources with a grain of salt.
Due to reaching out to many of our English respondents via Discord, there is a bias towards this platform in the data. The general opinion and the total amount of people using Discord has been affected because of this.
News-reading on social media #
We asked people if (and how) they read news on social media. The responses where pretty evenly distributed.
In the Dutch form we see that 42.4% of respondants actually follow news pages on social media, while in the English one only 33.3% does this.
That doesn't mean the rest doesn't read any news on social media. For the Dutch survey we saw that 18.2% of people do read news that they stumble upon while checking their socials. For the English survey a whopping 40% does this.
30.3% of Dutch respondants told they mostly check news via other ways, TV for example. Only 20% of English respondants does this.
Few people said they don't check any news at all on social media. This is 9.1% for the Dutch survey and 6.7% for the English survey.
General opinions on news on social media #
Instagram #
People on instagram are aware that not every article can be trusted. Most people follow trusted sources so they don't have to worry about false news. The fact that Instagram fact-checks news and gives a warning with doubtful articles is something Instagram users like.
Facebook #
75% of respondants find Facebook a bad source for news. It's not trustworthy and subjective. This might be the reason why Facebook isn't very popular anymore.
Twitter #
Twitter users like the short format for twitter-posts. It's a quick way to get information.
Twitter users still look out for trustworthy sources, they try to follow big news-pages and watch out when they read someones opinion on twitter.
Reddit #
Reddit seems to be very subjective. People in subreddits are biased towards the subject, this means it's hard to find good objective news articles.
Difference between news on social media and traditional media #
We asked people if they feel like there's a difference between news on social media and news via traditional media like television or newspapers. There were interesting answers.
People feel like social media news is heavily click-bait driven. Articles are often published with flashy titles to lure people in, with the intention of receiving ad-revenue.
The news on social media is more subjective. People write articles based on their own opinion and thus try to get readers to join their beliefs. News on traditional media is more objective, fact driven and with the goal of informing people.
People who read news on social media have to be wary of the sources they read and have to fact-check everything they read.
What's the last news story that you read that changed your opinion on something? #
In an attempt to see if social media news has any influence on the opinion of people we asked them to tell us the last opinion-changing article they read.
25% of people said that they don't remember or don't know if an article has changed their opinion on a subject. In other words 3 out of 4 people has at least once used news articles to form an opinion about subjects and is influenced by what is written by the journalist. That is a very interesting thing to think about.
Insights #
Screentime #
People don't realize how much time they spend online until they really think about it en look it up. It's amazing how technology has become something we just use without thinking about it. Social media to be specific has become a staple in our daily lives but in the responses we noticed that some people don't really want social media to be such a big part of their lives.
Images are popular #
We see that Instagram is becoming huge, in Belgium it's the most popular platform and also in the English survey it came in the top 3. The biggest difference between Instagram en other social media platforms is that Instagram is picture based. This makes media consumption even quicker leading to bigger amounts of information being processed by youth.
Cautious #
Youth is pretty cautious while reading news on social media. They check for facts and don't just go with whatever is being published.